
There are more investment options in Canada than you can shake a stick at! Stay on top of the best returns right here.
Latest News
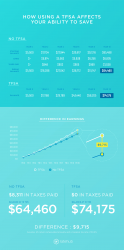


Here’s how much more a TFSA can help you save + MORE Jul 11th
There were more than 11.7 million TFSA holders in 2014, according to the latest statistics available from the Canada Revenue Agency (CRA).
Slowly but surely, more and more Canadians are opening a TFSA to supercharge their savings (the 2017 TFSA contribution limit is set at $5,500).
The TFSA is very .... More »
Alphabet shares follow in Amazon’s footsteps and top $1,000 + MORE Jun 5th
The parent company of Google and online retail juggernaut Amazon are part of a small group of stocks belonging to companies that have shunned stock splits
.... More »
The best high-interest savings accounts in Canada for 2025 + MORE Oct 14th
Savings comparison tool
Find the best and most up-to-date savings rates in Canada using the comparison tool below. Plus, use the filters to assess your estimated return based on the size of your balance.
Advertisement
Why trust us
MoneySense is an.... More »
The best TFSAs in Canada for 2026 + MORE Jan 30th
Featured TFSA Accounts
featured
EQ Bank TFSA Savings Account
Earn 1.50% tax-free on your cash savings.
Go to site
featured
.... More »
ETFs or index mutual funds in an RESP? Aug 27th
The right choice is about more than just fees [MoneySense].... More »
Freshii Inc. is aiming to expand its network of franchised stores by 150 to 160 outlets by the end of its current fiscal year, the company said Wednesday as it reported its fourth-quarter earnings.
Are U.S. stocks overvalued?
– moneysense.ca

Q: It is my understanding that the P/E ratio of the S&P 500 is hovering around 28. In the last 135 years, it had only been higher 4% of the time; once in 1929 and once just before the tech crash of 2000/2001. Do you think the future of U.S. stocks is a little obvious?
—Rod
A: There are many different ways to value stocks, ranging from the discounted cash flow (DCF) method to the price to earnings (P/E) ratio. The P/E ratio is probably the most common metric used by investors today.
The smart way to invest in U.S. equities »
The two primary types of P/E ratios are trailing 12-month price to earnings and forward 12-month price to earnings. Trailing P/E ratios are calculated by dividing the price of a stock by the actual reported earnings of a company for the past 12 months. This is the ratio you are referring to, Rod. Forward 12-month price to earnings are based on an estimate of earnings for the coming 12 months.
Estimated earnings are not as reliable as actual earnings. But actual financial results of a company or a stock market over the past 12 months may not necessarily be a predictor of potential earnings for the coming year…
Speculators super-heating the Toronto real estate market
– theglobeandmail.com
About 95 per cent of investment properties purchased in 2016 are losing money every month, says report
Freshii aims to add 150 to 160 restaurants this year
– theglobeandmail.com
Freshii released its first earnings report since it began trading on the TSX, reporting $16.1-million in revenue

