

What types of tax-free savings accounts (TFSAs) exist? Dec 19th
The best Visa credit cards in Canada for 2024 + MORE Jul 29th
The CAPE ratio, the 4% rule, and retirement anxiety Sep 24th
Making sense of the markets this week: December 15, 2024 Dec 13th

MoneySense’s free Excel template for your monthly budget + MORE Feb 14th
Making sense of the markets this week: January 14, 2024
– moneysense.ca
 Kyle Prevost, creator of 4 Steps to a Worry-Free Retirement, Canada’s DIY retirement planning course, shares financial headlines and offers context for Canadian investors.
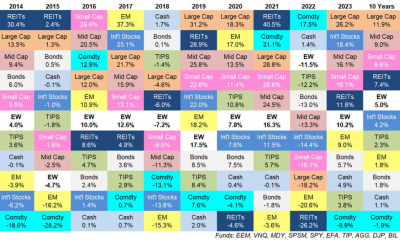
2023 asset returns versus the last 10 years
As we enter the New Year and investing columnists write their prediction columns, it’s also a worthwhile exercise to take a look back at the history of just how varied returns have been across various asset classes. The chart below comes from Wealth of Common Sense blogger Ben Carlson. It shows and the equities shown were available on the major U.S. stock exchanges.
Source: A Wealth of Common Sense
Here’s the Canadian total market data below for comparison. Slide the columns right or left using your fingers or trackpad, or hover your mouse over the table to reveal a scroll bar below.
201420152016201720182019202020212022202310-yearCAD total market10.55%-8.32%21.08%9.10%-8.89%22.88%5.60%25.09%-5.84%11.75%7.62%Source: SPG Global
My main takeaways from Carlson’s data:
The year 2022 was really bad for the value of most assets; 2023 was really good…

